


Crisis Is a Sign of Growth
[Trend] Analysis of the Status of the 2013 Art Market
| Scope of Research | Period | January 1, 2013–December 31, 2013 |
| Research Period | Target Period | January 1, 2013–December 31, 2013 |
| Fieldwork Period | June 10, 2014–August 16, 2014 | |
| Research Targets | Major Distribution Channels | Galleries (432), auction companies (11), art fairs (35) |
| Public Domain | Architectural installations, art banks, art museums (185) | |
| Research Content | The transaction of art pieces, financial condition, etc. | |
| Research Methods | Surveys, literature studies | |
| Survey Host | Ministry of Culture, Sports, and Tourism | |
| Survey Supervisor | Korea Arts Management Service | |
A report conducted by the Korea Arts Management Service, the “2014 Survey of the Condition of the Art Market in 2013” consists of data on the operating conditions and transaction of pieces from 432 galleries—which are the essential distribution channels of the art market—as well as 11 auction companies, 35 art fairs, and 185 architectural art pieces, art banks and art museums. All institutions and organizations surveyed fall under the public domain, with each being analyzed and categorized in a fair and objective manner.
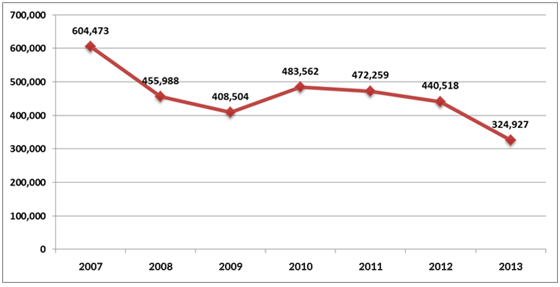
KRW 324.9 billion (Based on the Monetary Sum of Art Transactions): The Size of the Domestic Art Market in 2013
A 2.6 percent decrease in the size of the domestic art market compared to 2012
According to the results of a 2014 survey of the status of the art industry, in 2013 the size of the domestic art market was KRW 324.9 billion, with KRW 255.7 billion from pieces sold through the major distribution channels, and KRW 69.1 billion in pieces purchased in the public domain. When considering the KRW 604.4 billion in art sales that occurred in 2007, a peak year in the Korean art market, and 2008, when the market size decreased by 24.6 percent to KRW 455.9 billion, the 2013 figures represent a severe stagnation in the art market.
| Division | Transaction Sum (KRW million) | Pieces Sold and Purchased (No. of Pieces) | Circumstances of overlap (C) | |||||||
| Transaction Amount(A) | Amount Overlapping with (C)(B) | Total (A-B) |
Number of pieces(A) | Overlapping Number(B) | Total (A-B) | |||||
| Main Distribution Channels | Galleries(432) | 194,504 | 6,381 | 188,123 | 9,869 | 105 | 9,764 | A. Excepting architectural art installation pieces sold | ||
| Auction Companies(11) | 59,216 | - | 59,216 | 9,922 | - | 9,922 | - | |||
| Art Fairs(35) | 66,113 | 57,706 | 8,407 | 15,373 | 9,964 | 5,409 | B. Excepting pieces sold at art fairs with gallery participation | |||
| Subtotal | 319,833 | 64,087 | 255,746 | 35,164 | 10,069 | 25,095 | - | |||
| Public Domain | Architectural Installations | 58,718 | - | 58,718 | 617 | - | 617 | - | ||
| Art Bank | 1,674 | 302 | 1,372 | 146 | 69 | 77 | C. Excepting pieces purchased through the immediate purchase system (at art fairs) | |||
| Art Museums(182) | 12,070 | 2,979 | 9,091 | 1,367 | 291 | 1,076 | D. Excepting pieces purchased through galleries, auction companies, and art fairs | |||
| Subtotal | 72,462 | 3,281 | 69,181 | 2,130 | 360 | 1,770 | - | |||
| Transaction Volume | 392,295 | 67,368 | 324,927 | 37,294 | 10,429 | 26,865 | - | |||
▲ <Table 2> Estimated Transaction Volume of Art in the 2013 Domestic Art Market
|
|
| ▲<Figure 1> Changes in the Size of the Domestic Art Market 2007–2013 |
Major Distribution Channels:
The expansion of the low- and mid-range market, and the exclusive growth of the art fair
When examining the volume of transactions in 2013 among major distribution channels, the monetary sum of the transactions decreased compared to the volume of transactions(when examined alongside the 2012 data, the sum of transactions decreased by 20.5 percent, and the number of pieces sold increased by 28.4 percent). Together, these figures lead to the conclusion that, overall, sales of low- and mid- range pieces increased.
| Division | 2010(KRW million) | 2011(KRW million) | 2012(KRW million) | 2013(KRW million) | 2013 Increase/Decrease from previous year | |
| Increase/Decrease in Sum(KRW million) | Rate of Increase/Decrease(%) | |||||
| Total (Sum) | 451,578 | 420,992 | 402,431 | 319,833 | -82,598 | -20.5 |
| Galleries (Average) | 1,190.1 | 973.1 | 1,007.5 | 609.4 | -398.1 | -39.5 |
| Auction Companies (Average) | 4,882.9 | 5,588.4 | 6,559.5 | 5,383.3 | -1,176.2 | -17.9 |
| Art Fairs (Average) | 1,423.1 | 1,290.2 | 1,200.6 | 1,889.0 | 688.4 | 57.3 |
▲ <Table 3> Yearly Increase in the Average Sum of Art Transactions
| Division | 2010(No. of Pieces) | 2011(No. of Pieces) | 2012(No. of Pieces) | 2013(No. of Pieces) | 2013 Increase/Decrease from Previous Year | |
| Increase/Decrease(No. of Pieces) | Rate of Increase/Decrease(%) | |||||
| Total (Sum) | 29,577 | 33,517 | 27,377 | 35,164 | 7,787 | 28.4 |
| Galleries (Average) | 47.4 | 49.8 | 31.1 | 30.9 | -0.2 | -0.6 |
| Auction Companies (Average) | 824.8 | 802.2 | 624.3 | 902.0 | 277.7 | 44.5 |
| Art Fairs (Average) | 176.3 | 197.8 | 307.8 | 439.2 | 131.4 | 42.7 |
▲ <Table 4> Yearly Increase in the Average Number of Pieces Sold
In particular, while the monetary sum of art sales at the auction companies decreased by 17.9 percent compared to 2012, the number of pieces sold increased by 44.5 percent, with the sales volume of pieces less than KRW 60 million increasing from 93.8 percent of pieces sold in 2012 to 97.9 percent in 2013, signaling the expansion of the low- and mid-range market.
|
|
| ▲ <Figure 2> Estimated Transaction Volume of Art at Auction Companies, by Price (2012–2013) — According to Number of Pieces Sold Note: Based on data from 13 auction companies in 2012 and 11 auction companies in 2013 |
Unlike other channels, the art fair market, which had thus far led the low- and mid-range market, showed exclusive growth in both the monetary sum of art sales and the volume of sales compared to 2012 (57.3 percent and 42.7 percent growth, respectively). The growth of the 16 gallery-participating art fairs, with two new fairs, is particularly striking, with the average price of each piece rising from KRW 2.2 billion in 2012 to KRW 3.6 billion, and the average number of pieces sold more than doubling from 294 to 622. This growth injected energy into the stagnant art market, and offset, if by a little, the overall downturn in the market.
| Division | Number of Cases | Selling Price(KRW million) | Pieces Sold(No. of Pieces) | |||||
| Average | Median | Total | Average | Median | Total | |||
| Total (Sum) | (35) | 1,889.0 | 559 | 66,113 | 439.2 | 199 | 15,373 | |
| Management System | Gallery-participatig | (16) | 3,606.6 | 1,500 | 57,706 | 622.7 | 295 | 9,964 |
| Artist-participating | (19) | 442.5 | 150 | 8,407 | 284.7 | 494 | 5,409 | |
▲ <Table 5> 2013 Art Fair Sales
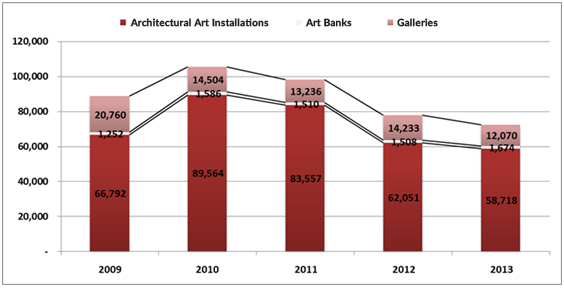
The Public Domain
-Shrinking budgets lead to a decrease in the purchase of art
The decrease in the installation of architectural art pieces, and the shrinking budget of the national public museums led to a decrease in the public purchase of art, and to a downturn in the market overall. Only art banks showed an increase (11.0 percent, approximately KRW 100 million), but the scale of the architectural art installation market, which had been declining since 2010, fell to KRW 58.7 billion in 2013, following the decrease to KRW 62 billion in 2012. The shrinking budgets of art museums led to a decrease in the purchase of pieces, and despite the increase in the number of museums, the public domain showed a KRW 2.1 billion decrease from 2012 onward.
|
|
| Division | 2012(KRW million) | 2013(KRW million) | Rate of Increase/Decrease(%) |
| Government Funding for National and Public Art Museums | 197,137 | 141,697 | ▴28.1 |
| Total Spent on Art at National and Public Art Museums | 12,028 | 9,477 | ▴21.2 |
▲ <Table 6> Government Funding for National and Public Art Museums and the Estimated Sum Spent on Art (2012–2013)
Note: Based on data from 19 national and public art museums in 2012, and 21 in 2013
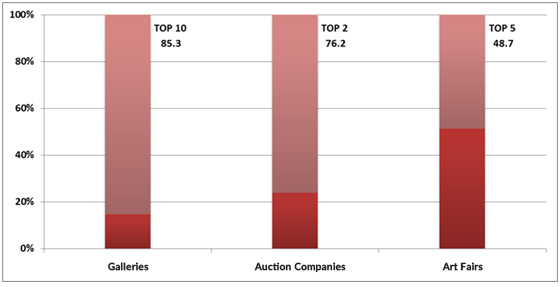
The Unchanging Polarization of the Market:
Performance slump at large-scale art galleries and auction companies affects the dwindling of the market
The top 10 galleries, making up 2.3 percent of 432 galleries, have a market share of 85.3 percent. The top two auction companies that make up 18.2 percent of 11 companies have a market share of 76.2 percent. And the top five art fairs, that make up 14.3 percent of 35 art fairs, have a 48.7 percent share of the market, revealing the unchanging polarization of the domestic art market. Although there was some change at the top in the gallery market, there were no major changes overall, and keeping this in mind one can see that the top-10 group performed poorly in a stagnant market and also played a role in the shrinking of the market overall.
|
|
| ▲ <Figure 4> Market Share of Top Groups in Major Distribution Channels According to the Monetary Note: Galleries n = 432 / Auction companies n = 11 / Art fairs n = 35 |
| 2012 | 2013 | |||
| Division | Volume of Art Sales(KRW million) | Division | Volume of Art Sales(KRW million) | |
| Galleries | Total | 275,136 | Total | 194,504 |
| Top 10 | 275,382 | Top 10 | 165,851 | |
| Other 387 | 29,754 | Other 422 | 28,653 | |
| Auction Companies | Total | 85,274 | Total | 59,216 |
| Top 2 | 63,617 | Top 2 | 45,106 | |
| Other 11 | 21,657 | Other 9 | 14,110 | |
| Art Fairs | Total | 42,021 | Total | 66,113 |
| Top 6 | 23,311 | Top 5 | 32,180 | |
| Other 29 | 18,710 | Other 30 | 33,933 | |
▲ <Table 7> Top Groups among the Main Distribution Channels, and Their Market Share (2012–2013)
The year 2013 was the most difficult year in recent memory for Korea’s domestic art market. The implementation of the capital gain tax and various social incidents happening in conjunction with an expanding lack of confidence in the art world, followed by the closure of galleries, whether temporary or permanent, as well as evacuations and consolidations in a market atmosphere of confusion, all characterized the start of the year. As such, the year ended without much hope of recovery. The growth of the low- and mid-range market, however, is definitely perceived to have had a significant influence on some of the changes seen in the market. A number of factors have contributed to the idea that, amid the unusual growth seen in 2013, the year saw the market structure adapt to one that was safer and more stable: the simultaneous appearance and energetic participation of a broad range of new and potential collectors, the increasingly active presence of a variety of artists beyond those who had once been overemphasized in the market, the increased participation of new artists (due to a widening of the actively traded market), and more. The year 2013 is seen as the year when the domestic art market began to fall back into normalcy, and against such a viewpoint I anticipate that the analyses of 2014 will reflect even further growth in the field.
 PREV
PREV
.JPG)
.jpg)
.jpg)
.jpg)
.jpg)

;)


