


2012 Survey for the Present Condition of the Performing Arts
(Performance facilities as of 2011)
[Trend] 2012 Survey for the Present Condition of the Performing Arts (Performance facilities as of 2011)
○ Survey Target: 868 performance facilities (Final valid responses: 418/complete+sample surveys)
○ Survey Content: The current state of performance facilities, including basic and general conditions, personnel, finances, performance showings, etc.
○ Survey Reference Point: December 31, 2011
○ Period Surveyed: January 1, 2011–December 31, 2011 ○ Research Period: June 8, 2012–July 13, 2013 (approximately 5 weeks)
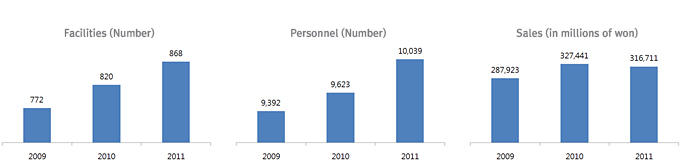
The scale of the performing arts industry in 2011—868 facilities, 10,039 personnel, and an estimated 316.7 billion won in sales
|
| |
| Developing scale of the performing arts industry (2009–2011) |
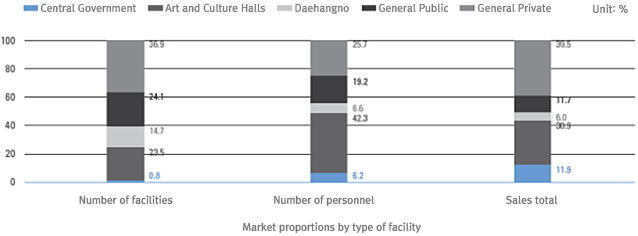
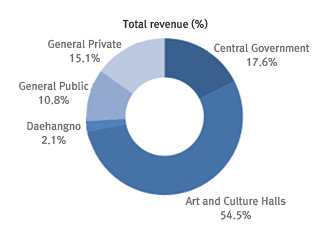
Examining performance facilities by facility type, it’’s possible to observe that general private facilities and art and culture halls take up a dominant proportion of the total performance facilities. In terms of number, the number of general private facilities took up the largest percentage, making up 36.9% of the total number of facilities. Art and culture halls demonstrated the highest number of personnel, with 42.3% of the total personnel, and the general private facilities had the highest proportion of earnings, earning 39.5 percent of the total sales.
Overall, central government facilities and art and culture halls had a higher proportion of personnel and sales per facility, while the Daehangno facilities demonstrated a lower proportion of personnel and sales per facility. The general public facilities had a relatively lower proportion of sales for their number and personnel, and the general private facilities had a relatively lower proportion of personnel for their number and sales.
|
| |
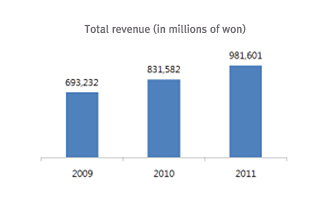
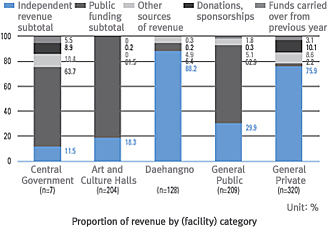
Public facilities earn 82.9 percent of the total revenue
Within the total revenue, the proportion of public funding is higher in public facilities and the proportion of independent revenue is higher in private facilities
|
|
| |
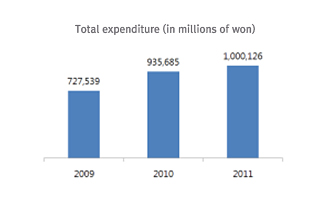
| Trends in financial scale (2009--2011) | ||
|
|
| |
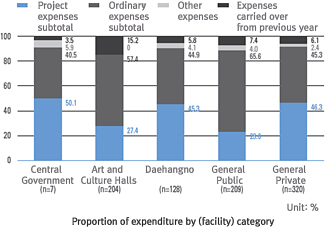
| Financial scale by facility type | ||

|
|
| |
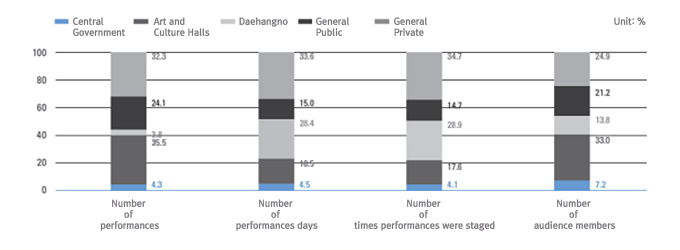
In the performance showings, art and culture halls have the highest proportion of performances and audience numbers
General private facilities have the highest proportion of music audiences
|
|
| |

|
|
| |
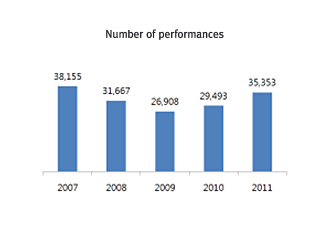
| Trends in performance showings (2007--2011) | ||
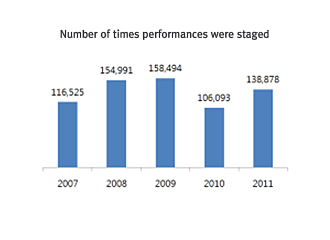
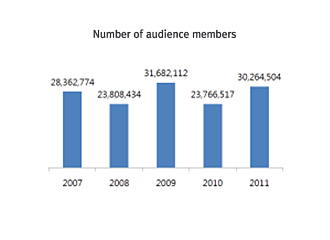
Overall, central government facilities had a relatively higher proportion of audience members to their number of performances and number of times performances were staged. Art and culture halls and general public facilities had a relatively lower proportion of performance days and times to their number of performances and number of audience members. Daehangno facilities demonstrated a relatively higher proportion of audience members, number of performance days and number of performances staged to their number of performances. Finally, general private facilities had a relatively lower proportion of audience members to their number of performances, number of times performances were staged, and number of performance days.
|
| |
| Proportion of performance records by facility type |
| Genre | Theater(%) | Musical(%) | Dance(%) | Ballet(%) | Western music(%) |
Opera(%) | Traditional Korean music(%) |
Multi-genre(%) | Total(%) |
|---|---|---|---|---|---|---|---|---|---|
| Central government |
9.5 | 1.5 | 8.1 | 1.5 | 54.1 | 2.7 | 18.9 | 3.7 | 100.0 |
| Art and culturehalls |
14.2 | 14.0 | 5.8 | 1.3 | 45.0 | 1.1 | 9.4 | 9.2 | 100.0 |
| Daehangno | 77.1 | 7.7 | 4.4 | 3.9 | 0.3 | 0.0 | 1.9 | 4.7 | 100.0 |
| General public |
13.0 | 12.0 | 6.8 | 2.4 | 9.5 | 2.0 | 13.3 | 41.0 | 100.0 |
| General private |
7.2 | 7.7 | 3.1 | 1.0 | 50.2 | 1.5 | 2.1 | 27.2 | 100.0 |
Proportion of genre (of the number of performances)
| Genre | Theater(%) | Musical(%) | Dance(%) | Ballet(%) | Western music(%) |
Opera(%) | Traditional Korean music(%) |
Multi-genre(%) | Total(%) |
|---|---|---|---|---|---|---|---|---|---|
| Central government |
16.2 | 20.1 | 4.4 | 4.6 | 35.8 | 6.4 | 9.9 | 2.6 | 100.0 |
| Art and culturehalls |
15.1 | 30.2 | 3.7 | 3.5 | 27.4 | 1.8 | 5.6 | 12.8 | 100.0 |
| Daehangno | 84.2 | 14.6 | 0.3 | 0.1 | 0.0 | 0.0 | 0.5 | 0.2 | 100.0 |
| General public |
13.1 | 24.8 | 9.0 | 4.3 | 6.8 | 4.2 | 11.5 | 26.4 | 100.0 |
| General private |
9.6 | 59.4 | 1.2 | 0.5 | 13.7 | 1.0 | 0.5 | 14.1 | 100.0 |
Proportion of genre (of the number of audience members)
The 2012 Survey for the Present Condition of the Performing Arts (Performance facilities as of 2011) has a margin of sampling error of ±5.6% points, at 95% confidence. A Report on the Present Condition of the Performing Arts, including the above, will be distributed in October 2012 at regional performance halls, art and culture halls, and other relevant institutions.
 PREV
PREV
.JPG)
.jpg)
.jpg)
.jpg)
.jpg)

','http://www.theapro.kr/eng/now/now_view.asp?idx=1000','http://www.theapro.kr/DATA/BBS1/썸네일(4).gif','Organized by the Ministry of Culture, Sports and T..');)


